For over fifty years, the people of Levenmouth lived without a railway.
Not because the towns disappeared. Not because people stopped needing jobs, education, investment, or opportunity. But because, in 1969, the rail connection linking this part of Fife to the rest of Scotland was cut away.
It was a decision shaped by an era that saw the future of transport through the lens of rising car ownership. Rail, buses, and mass transit were increasingly treated as balance-sheet problems rather than as national infrastructure tools for shaping how economies grow and how communities stay connected.
Over time this disconnection compounds. Fewer employers invest. Fewer people commute outward for higher-paying work. Young people leave in search of better opportunities. Town centres decline. Opportunity narrows. Entire communities slowly become economically lost.
Simply put, railways shape labour markets. They influence where housing develops, where businesses open, where people choose to live, and whether deprived communities remain connected to economic growth or isolated from it.
Cities do not emerge randomly but rather grow around movement, accessibility, and connectivity. From London’s Underground to the rail corridors that built industrial Britain, transport is one of the most fundamental forces shaping urban development.
Yet public debate around rail projects is often reduced to a narrow question:
When measured purely through ticket revenue or operational profit, many transport projects appear difficult to justify. The high cost of construction, especially in the modern climate, means that the financial returns from fares alone often look modest compared to the upfront investment required.
But this framing misses the much larger economic question: what activity becomes possible because the infrastructure exists in the first place?
A new railway line will increase passenger numbers, but its real impact extends far beyond transport demand. It may also increase employment, improve access to education, attract businesses, raise productivity, stimulate housing demand, and reconnect communities to regional or even international economies.
In other words, transport infrastructure does not just move people, it moves opportunity.
In this article, I explore that central idea. I believe good transport links are fundamental to whether towns and cities can genuinely thrive, and there is no better example of this than the reopening of the Levenmouth rail link. It also happens to be relatively close to where I am based, which makes the question feel more immediate.
To do that properly, I built a difference-in-differences analysis using real claimant count data, and an agent-based simulation of the local economy, to try to actually measure what reconnecting a community does to employment and business activity over time. The interactive version of that simulation is linked in the article.
Levenmouth: Fifty-Five Years Disconnected
The place
Levenmouth is a collection of post-industrial towns on the southern Fife coast: Leven, Methil, Buckhaven, Cameron Bridge, and Kennoway. Together, these communities have a combined population of around 37,000 and share a closely linked social and economic history.
The area grew rapidly during the nineteenth century as coal mining, heavy industry, and manufacturing became central to the local economy. Shipbuilding, textiles, and engineering also played important roles in shaping the region’s identity and providing employment for generations of residents.
Employers such as the Silverburn Flax Mill were among the largest sources of employment in the area. Coal collieries in and around Methil and Buckhaven also became major employers, attracting workers from across Scotland and contributing to rapid population growth. The development of Methil Docks and the original railway network further strengthened Levenmouth’s industrial economy by improving trade and transport links along the east coast.
In Methil alone, the rapid economic growth meant that the local population increased from 500 in 1861 to over 12,000 a century later. In fact, the rapid industrialisation has meant that very little of pre-1887 Methil exists today; the layout and feel of that town have been lost to time.
The Methil Cultural Centre, housed in the original Post Office building dating back to 1936 and built during the brief reign of Edward VIII, is perhaps the most tangible reminder of that era. It is a building that tells its own story about the community's layered social and economic history.
Not the first connection
The first railway to reach Leven was opened in 1854, connecting the town to Thornton Junction on the Edinburgh and Northern Railway. The arrival of the railway helped transform Leven into a popular seaside destination, attracting increasing numbers of visitors from across Scotland. Travel from Glasgow, in particular, became especially popular as improved transport links made the Fife coast more accessible.
In 1857, the East of Fife Railway extended the line to Kilconquhar. The line was later extended further to Anstruther in 1863, following the earlier amalgamation of the railways into the Leven and East of Fife Railway in 1861. The network was eventually expanded again through the Anstruther and St Andrews Railway, which connected the existing line to the popular university town of St Andrews.
With the completion of the extension to St Andrews, a coastal loop was formed linking the Fife towns between Thornton Junction and Leuchars Junction.
The railway was not just popular with foot passengers, it was also a vital freight line connecting the local industries to the wider Scottish economy. In particular, coal became hugely important in the final decade of the nineteenth century, driving a significant expansion of the docks at Methil in particular.
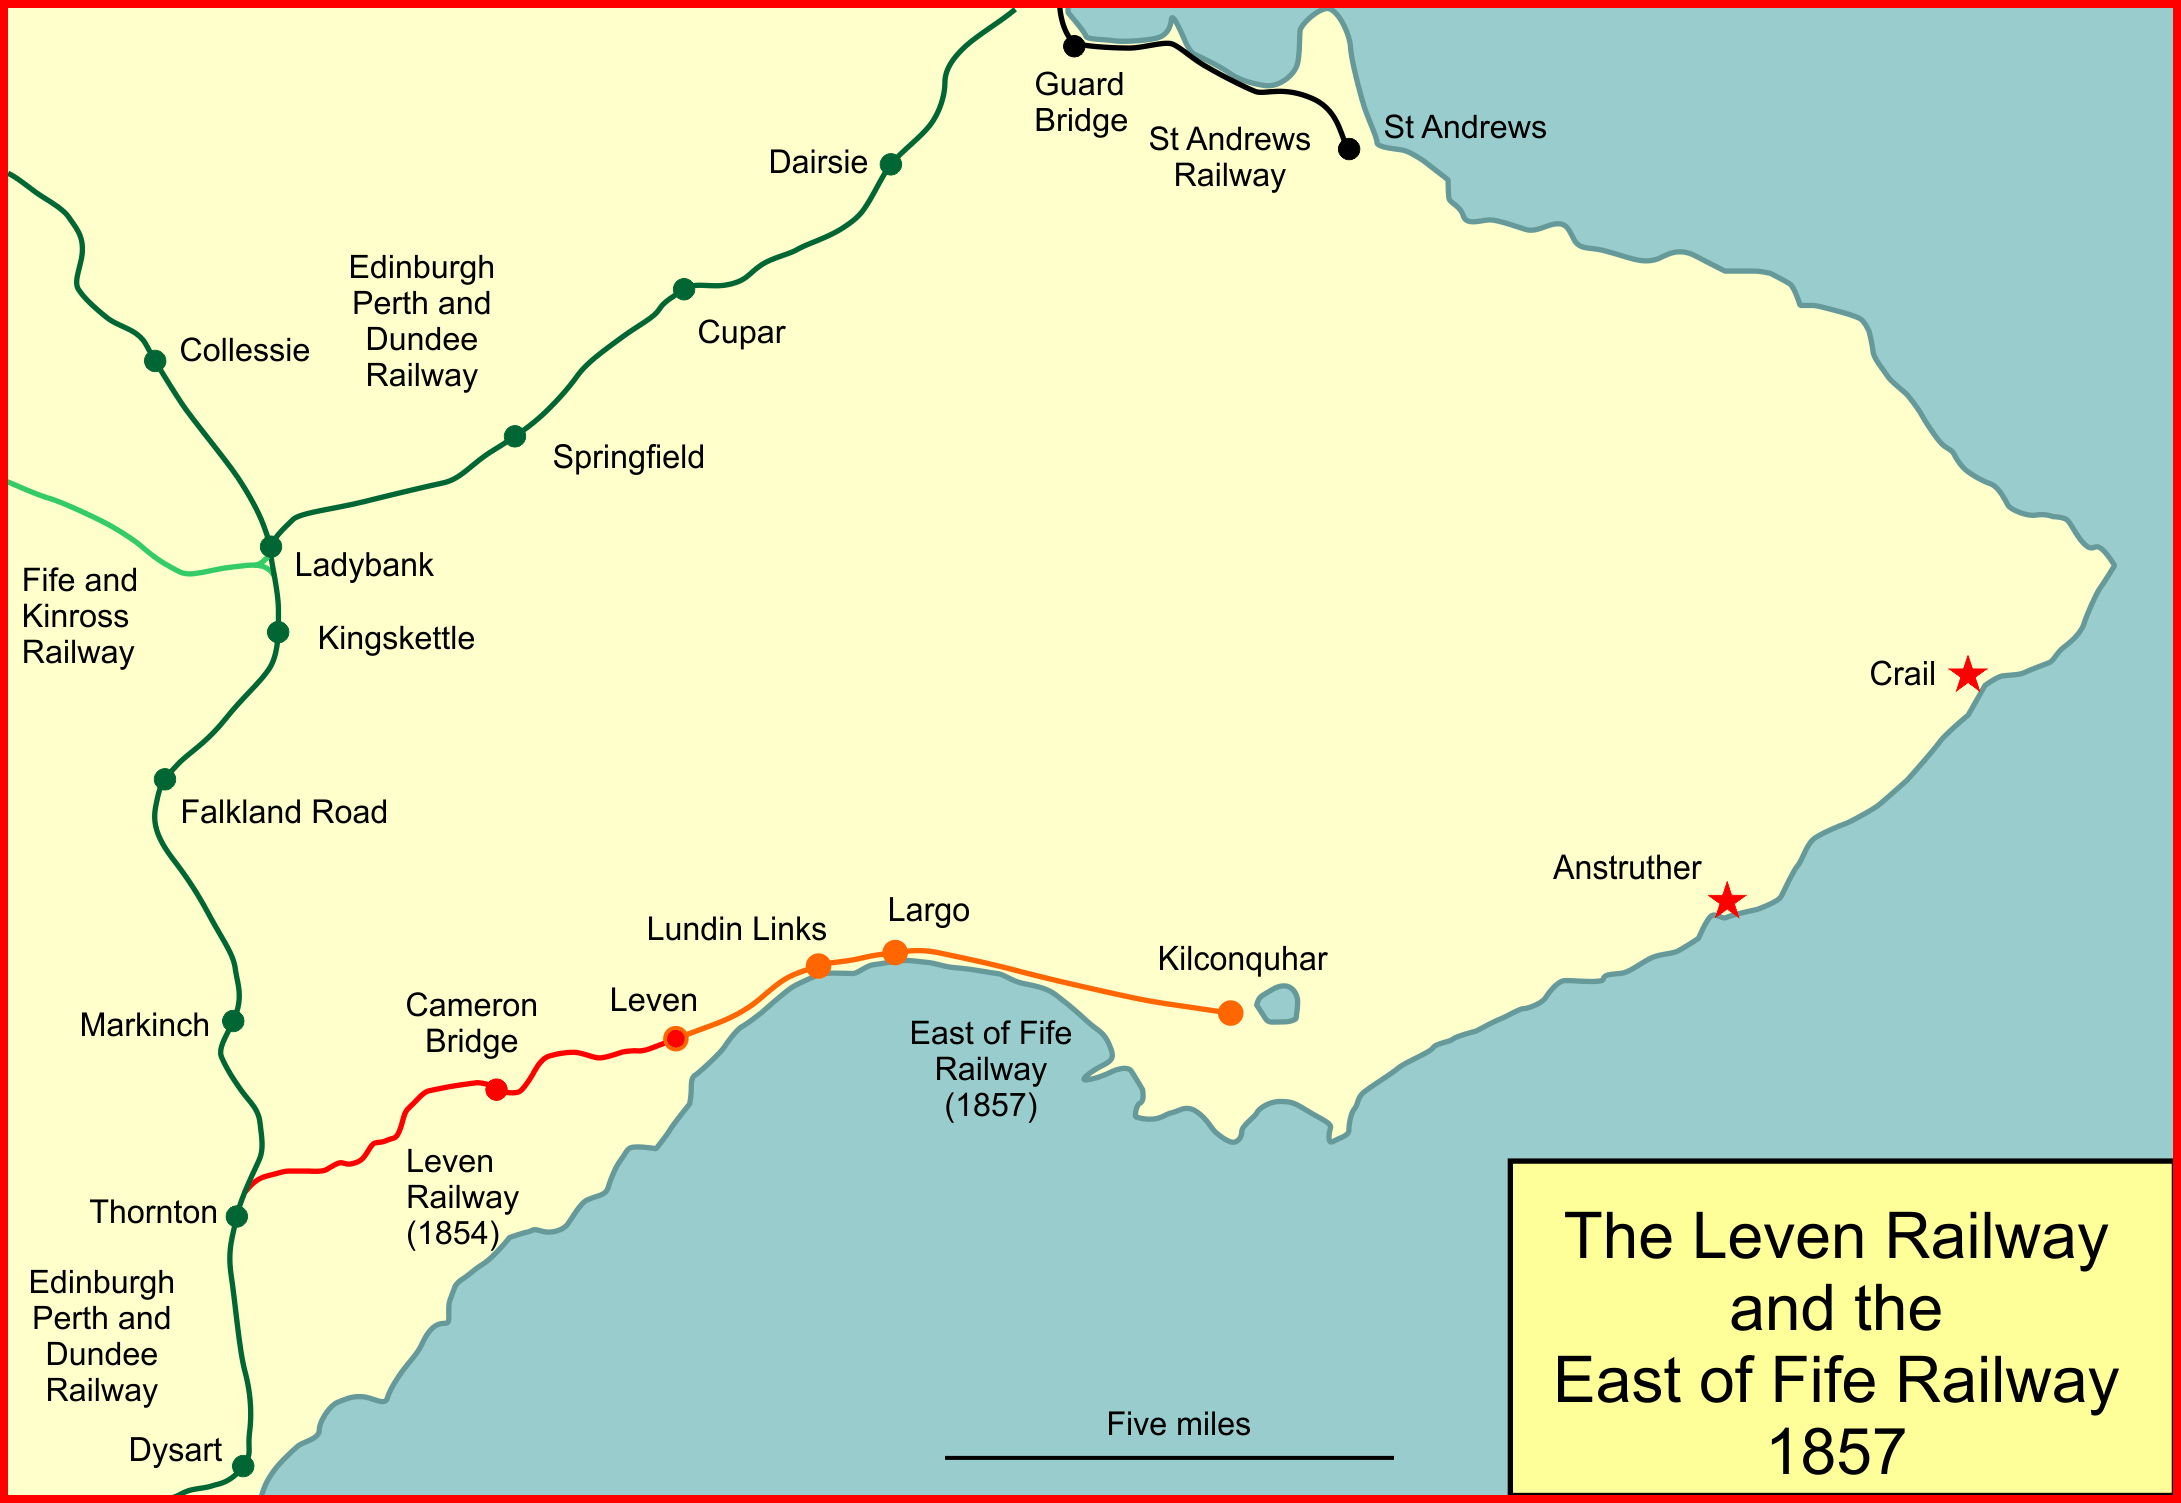
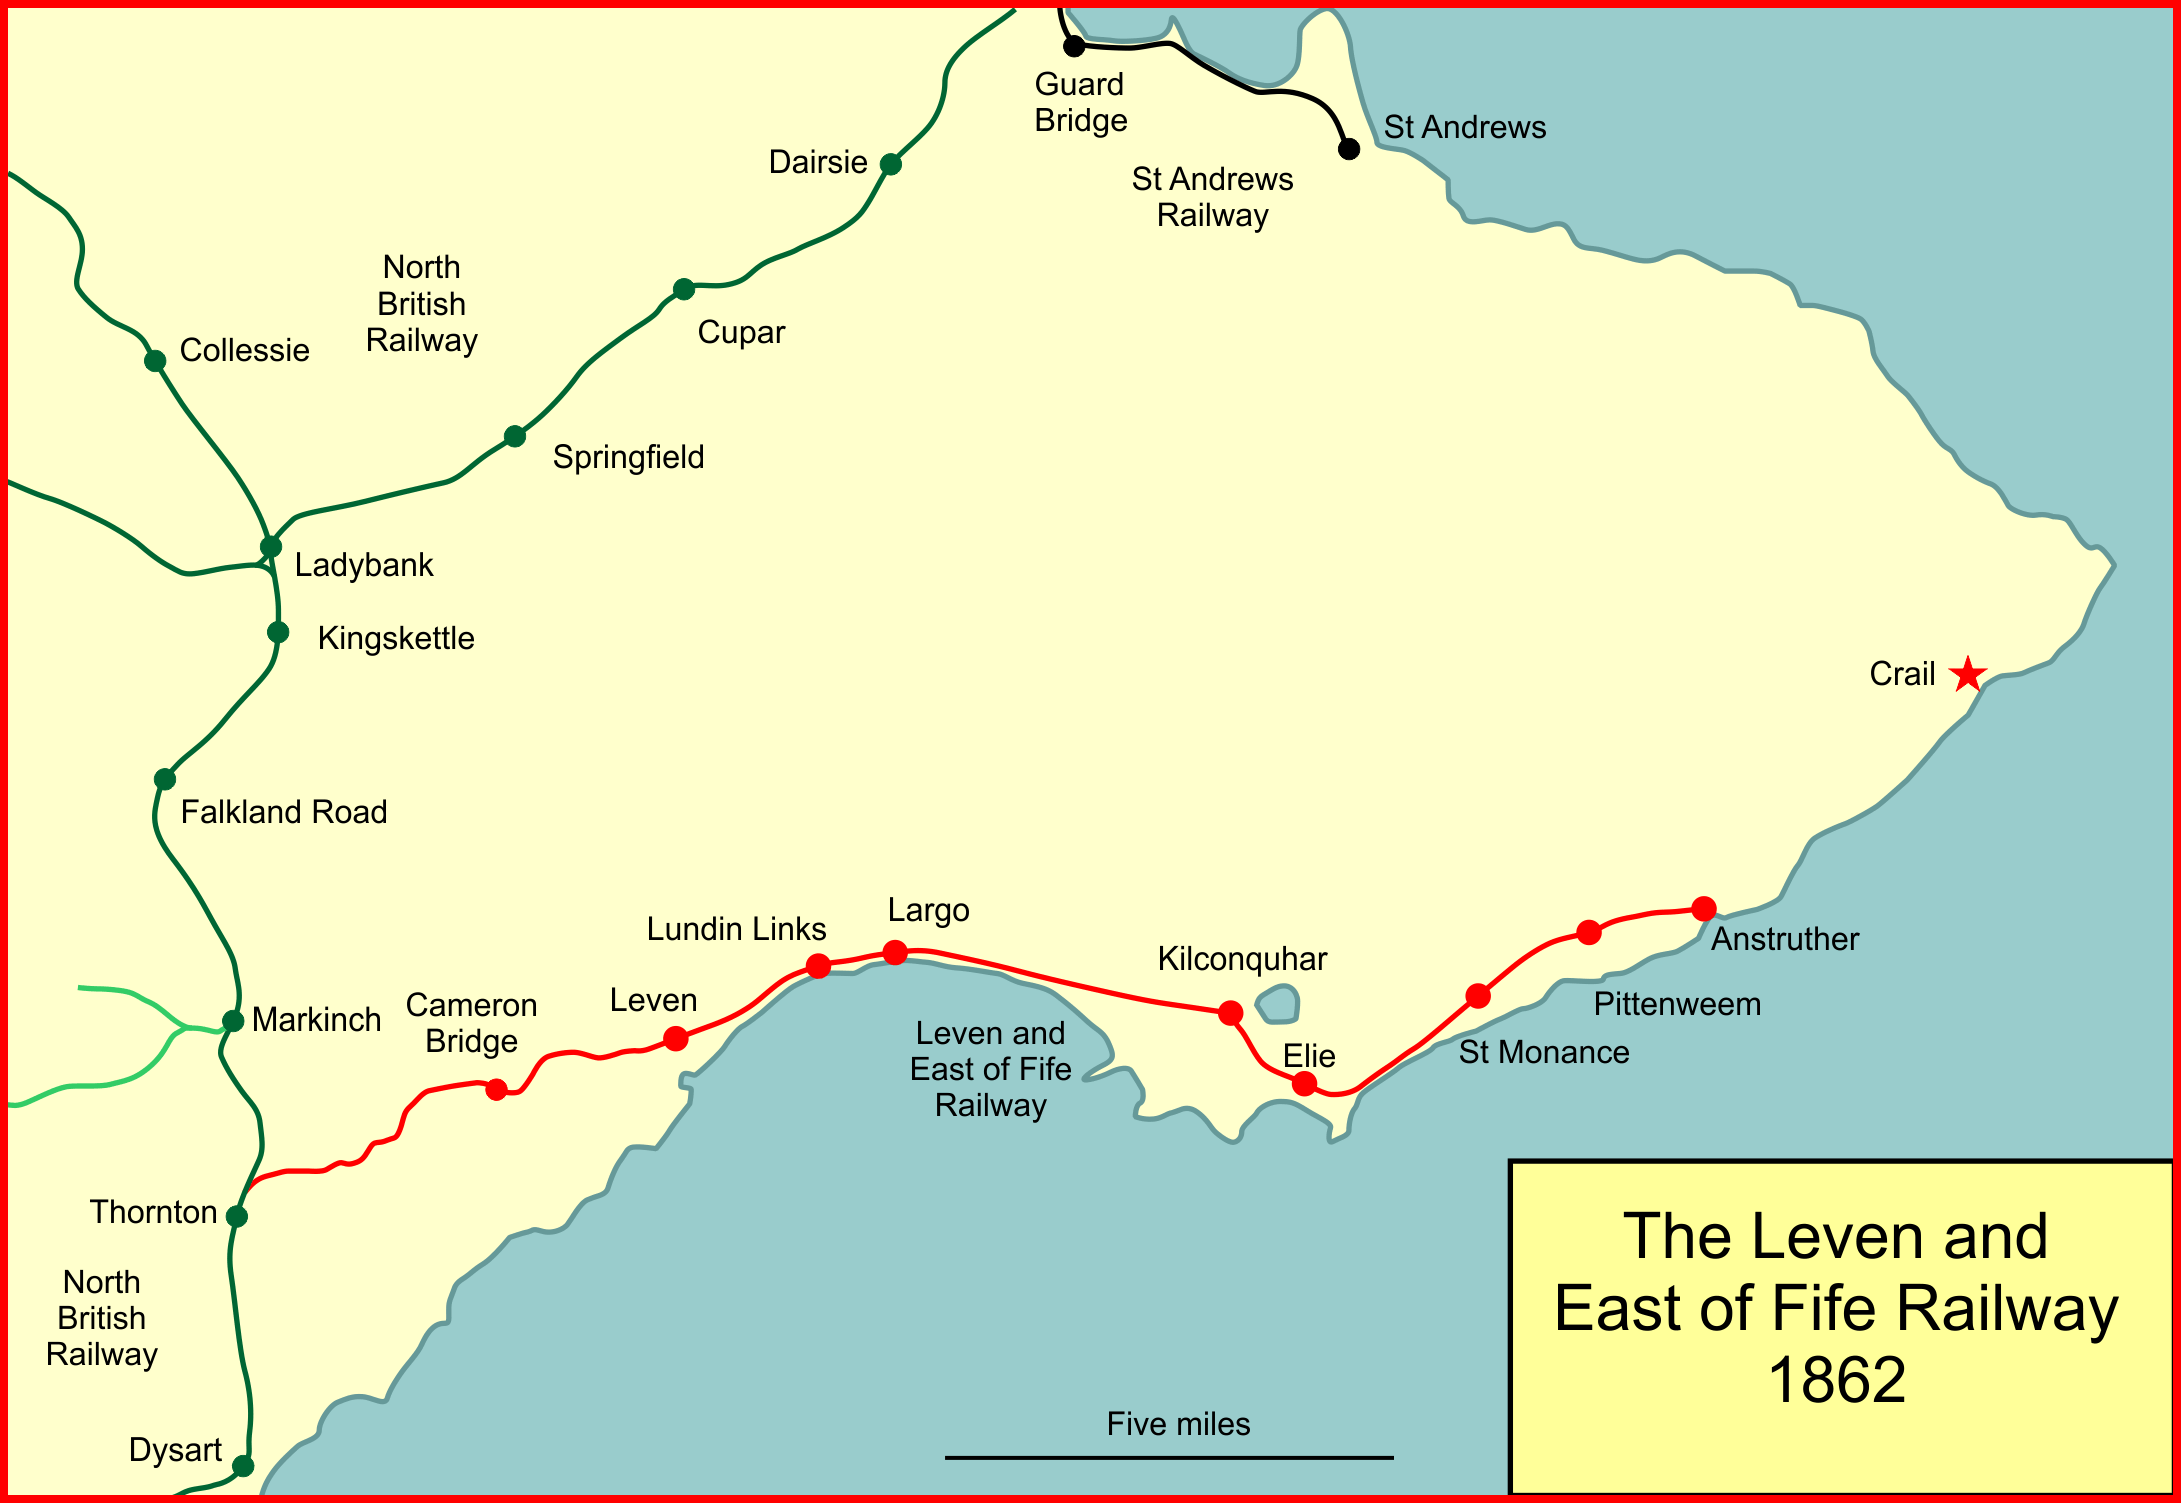
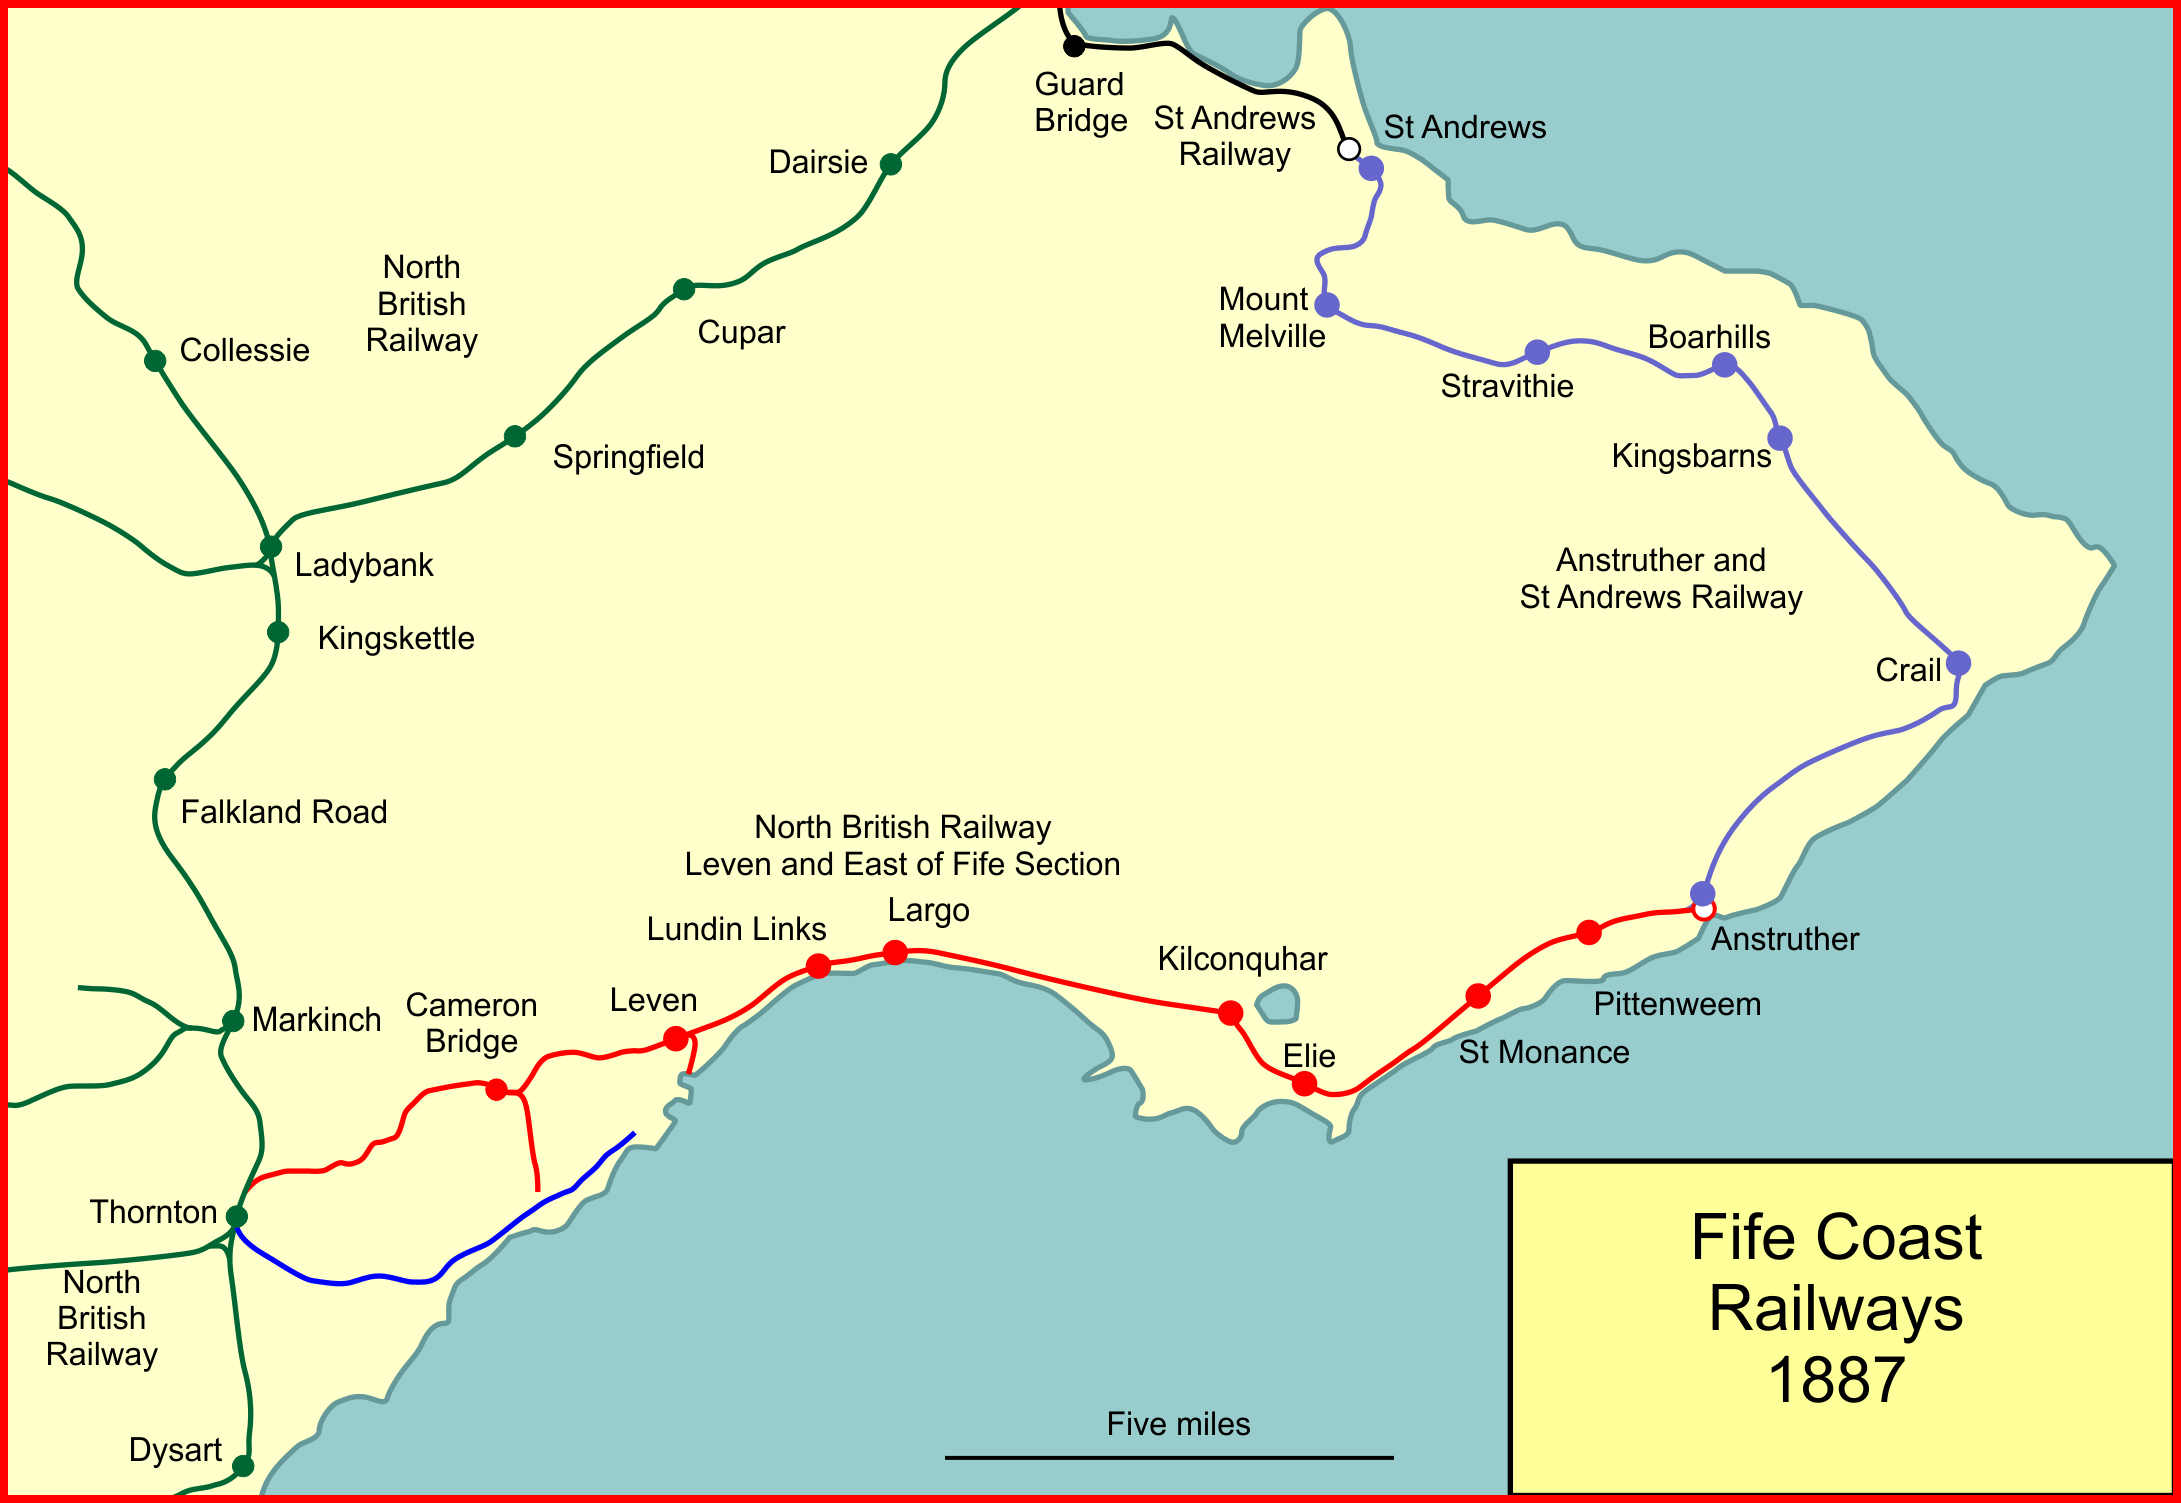
1857: Leven connected to Thornton Junction; the line reaches Kilconquhar.
The line remained a vital transport link for Levenmouth throughout the early 20th century. It was central to supporting the Methil docks which by 1923 became the principal coal exporting dock in all of Scotland.
Towards the mid-1900s, road traffic started to have a significant impact on the railway business. Meanwhile, the heavy industries that were once vital to the growth of the area began to decline. All coal collieries closed in the 1960s, including Wellesley in 1967, which once employed over 1,600 people producing 3,500 tons of coal daily.
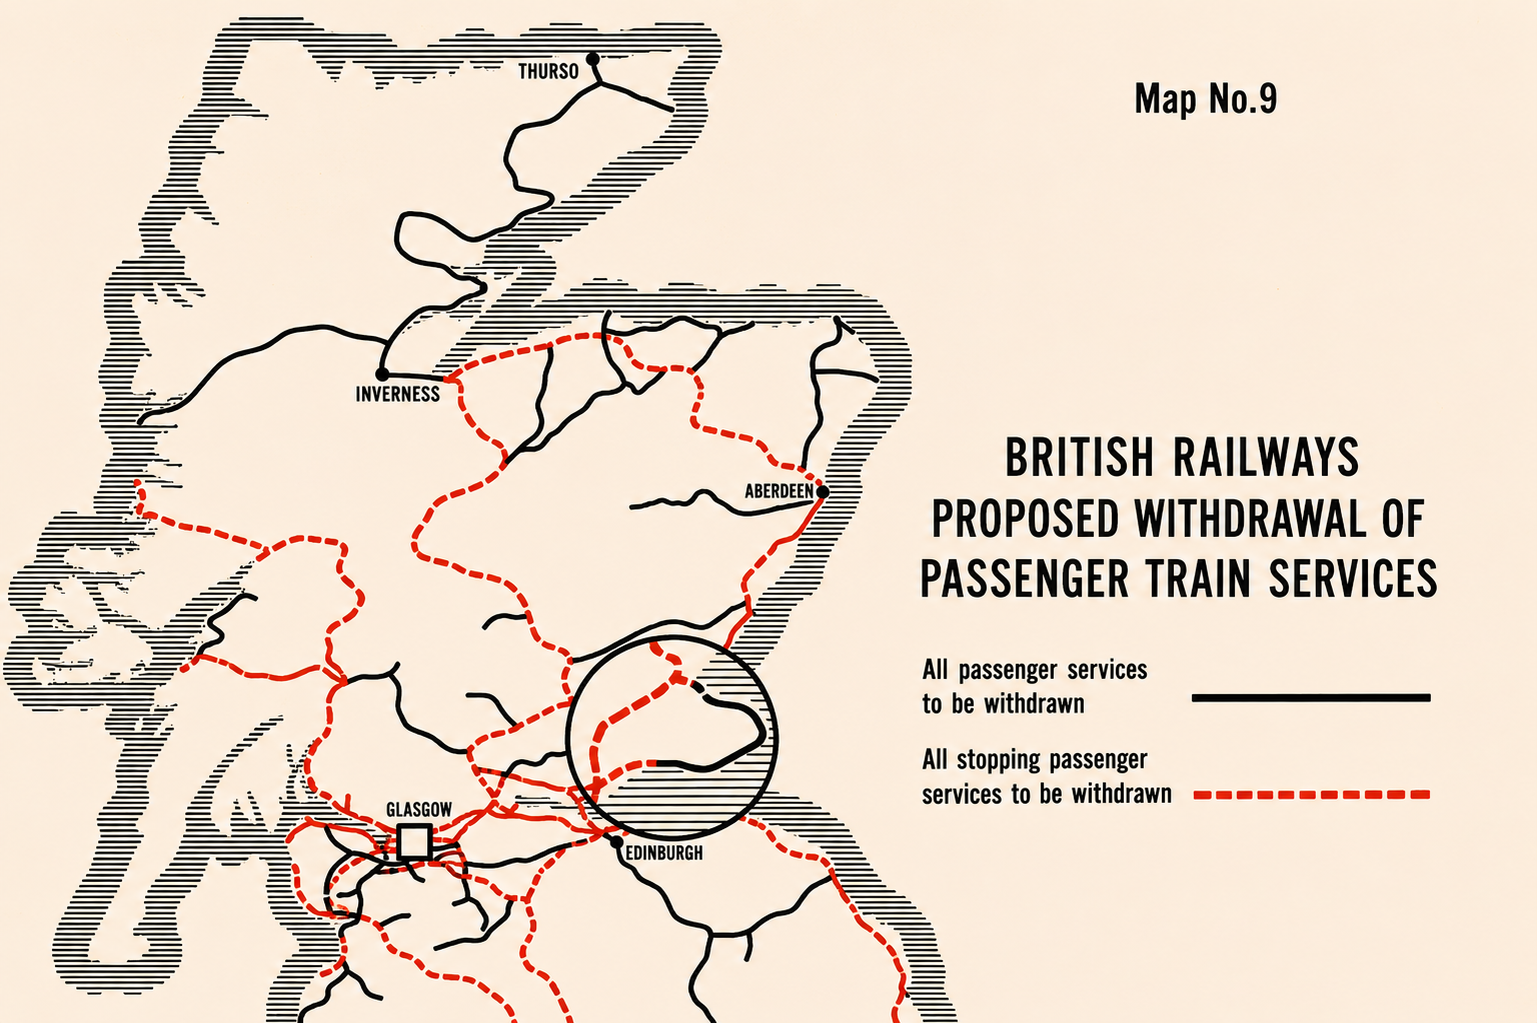
The decline of the region was starting to propagate in the railway usage statistics; and by the 1960s, the situation was starting to turn bleak. The infamous "Distribution of passenger traffic station receipts" map, published in March 1963 alongside the Beeching report, showed that every station between Leven and St Andrews was placed in the lowest revenue categories.
The Beeching Reports were two studies of the then-nationalised British railway network, produced with the aim of restructuring the system in the face of growing financial losses. The first report, published in 1963, recommended the closure of 5,000 miles of branch lines and 2,363 stations across Britain. This amounted to around 55% of all stations and 30% of the country’s railway network. It is this report that inspired me to write this article. In my view, it represents everything that was wrong with the way transport appraisal was conducted at the time and, in many cases, still is today. Many railway routes were judged as unprofitable when considered in isolation, with little regard for their wider social, economic, and regional importance.
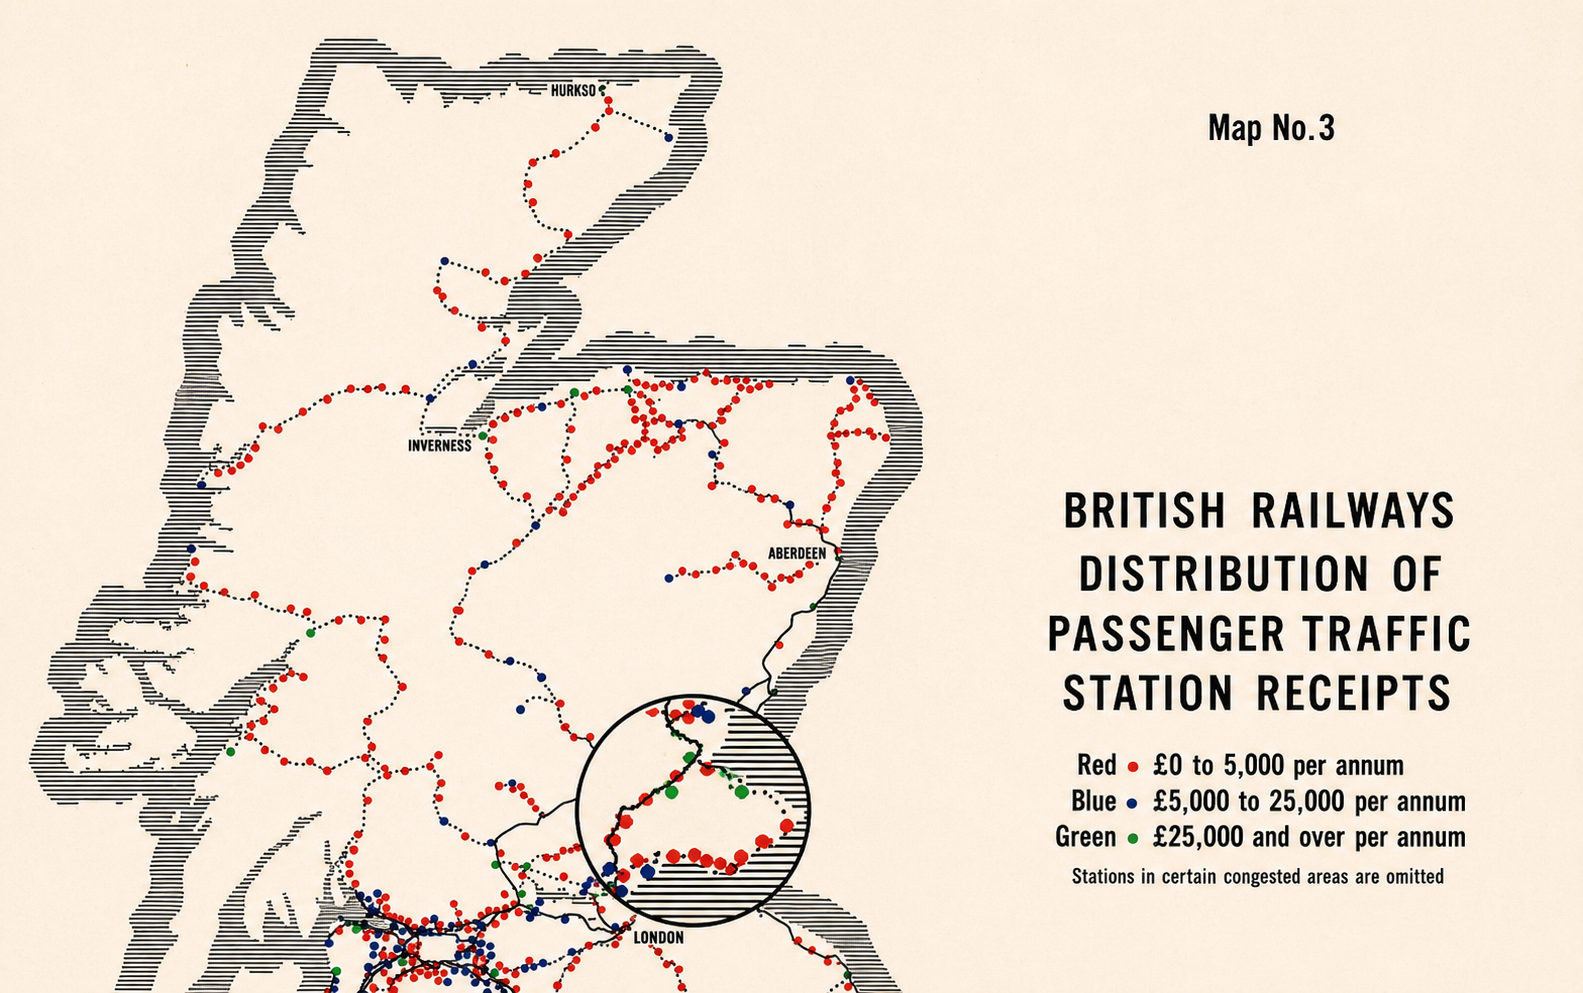
Map 3 - Distribution of passenger traffic station receipts. Every station on the Levenmouth and East Fife coast lines fell in the lowest revenue category.
The effects of the Beeching cuts are still felt to this day, with many areas across the UK being completely disconnected from any form of rail transport.
In Levenmouth, the cuts began with most local goods stations being closed in October 1964. The line from Leven to St Andrews was closed to passenger services as a whole in September 1965.
After the initial closures, it seemed that the line from Leven to Thornton Junction could potentially survive, but further losses and an even greater decline of foot traffic prohibited this. Passenger services ended on 6 January 1969. The towns, which had grown around the railway and the industries it served, were left without a direct rail connection for the first time in over a century.
Residual freight traffic continued. This was mainly comprised of grain to the Cameron Bridge distillery at Windygates, fuel for the Methil power station (which has since been closed and demolished) and a small public coal siding at the Leven dock. By the end of 1999, most of this traffic had disappeared. However, that ongoing freight use meant some of the infrastructure was maintained, and it later became an important practical argument for reopening: the track bed was still largely intact.
The reopening
A number of campaigns sought to reopen sections of the former Fife Coast railway. Particularly, the Thornton Junction–Leven link, which saw sustained advocacy from the early 1990s onwards.
In 1991, a proposal by the Scottish Association of Public Transport (SAPT) proposed a £1.5 Million proposal to open up the line to a Sprinter-class rolling stock service by 1993. It would have involved an hourly service between Leven and Edinburgh with an additional station at Windygates. This proposal had some merit; as mentioned above the line from Thornton Junction was still in use, albeit by freight services mainly to the Methil power station. However, this proposal was halted in 1992, with consultants stating the project was uneconomical; a decision that was deeply criticised as it focused narrowly on costs rather than the overall benefit to the local communities.
There was renewed political interest in 1996, when £8.9 million of borrowing was approved to improve rail services in Fife. However, local government reorganisation and the wider privatisation of the railways delayed its use. Despite initial political support, the line was not reopened. This was largely due to funding uncertainty and the fragmented governance structure that followed privatisation.
By the early 2000s, conversations around reopening started revolving around increasing freight traffic. The line was still partly intact to Methil, although degradation meant that reopening costs would have been closer to £20 Million. These proposals could also have laid the foundation for commuter flows from Leven to Edinburgh. The freight angle was helped by local industry developments; in particular the Diageo plant at Cameron Bridge and the Fife Renewable Energy Centre at Methil. A 2008 parliamentary debate further reinforced these ideas highlighting the proud and strong history of freight rail in the region.
After 2008, there were three Scottish Transport Appraisal Group (STAG) reports published on the reopening of the Leven link, and finally the Scottish Government announced that the line will be reopened for passenger and potential freight services. Construction began in 2020 with the clearance of vegetation. New sleepers were delivered in May 2021 and by July 2021 work started in removing the old and by this point dilapidated track. The main construction phase began in March 2022 and work on the new station at Leven began in February 2023.
The reopened route began scheduled services on 2 June 2024, with a total cost of £116 million. Services run from Leven and Cameron Bridge (which acts as the park and ride for the local area) into Kirkcaldy and on to Edinburgh. The project had been championed for years by local campaigners, the Levenmouth Rail Campaign, and eventually backed by the Scottish Government as part of a broader commitment to rail expansion.
Already the railway is giving promising results. Early ridership data from the Office of Rail and Road (ORR) shows 231,000 entries and exits across the two stations in the first ten months of operation; this is equivalent to roughly 277,000 annualised. This is broadly consistent with the ramp-up trajectory seen at Borders Railway in its first year, and represents approximately 37% of the long-run Transport Scotland projection of 750,000 annual journeys.
Why Standard Appraisal Undervalues Connectivity
In the UK, the dominant framework for evaluating transport investment is the Treasury’s WebTAG methodology. Its analysis centres heavily on journey time savings, vehicle operating costs, and accident reduction. Revenue projections and benefit cost ratios derived from these metrics play a major role in determining which projects receive funding.
In my view, this framework contains a major structural blind spot: it is designed to measure the value of moving faster between places that already exist. It is far less capable of capturing what happens when improved connectivity reshapes the economic geography of a region, altering access to labour markets, education, investment, and ultimately changing who can live where and what forms of economic activity become viable.
WebTAG has historically placed heavy emphasis on journey time savings because they are comparatively easy to quantify. Consider a proposal to widen a major road into a dual carriageway. If that road carries hundreds of thousands of commuters each day, even a modest reduction in average journey times can generate extremely large modelled economic benefits. Within the appraisal framework, those benefits may outweigh environmental damage, urban severance, or the long term consequences of increased car dependency.
The underlying assumption is that faster movement is inherently economically beneficial. Yet this risks narrowing transport policy to a question of throughput and congestion relief, rather than asking what kinds of places and economic structures transport investment should help create in the first place.
This matters because transport infrastructure does not simply reduce travel times within a fixed economy; over long periods, it changes the structure of the economy itself. New rail links can enlarge labour markets, alter patterns of business investment, increase land values, and reshape housing demand. Entire industries emerge or decline depending on what forms of connectivity exist. These effects are difficult to isolate within conventional cost benefit analysis because they are nonlinear, cumulative, and often only visible decades later. Standard transport appraisal is well-suited to measuring marginal efficiency gains within an existing network. It is considerably less effective when the question is one of structural transformation: situations where new infrastructure changes the scale, density, or organisation of economic activity itself.
The academic literature on transport connectivity tells a broader story than standard appraisal frameworks suggest. Studies of rail expansions across Europe and North America consistently find effects that extend well beyond the transport account: reductions in local unemployment, increases in wages and productivity, business formation, rising land and housing values near stations, and, in some deprived areas, measurable improvements in social mobility indicators.
Empirical evidence increasingly suggests that transport infrastructure can reshape regional economies in ways that conventional appraisal struggles to capture. Gibbons and Machin (2005) showed that proximity to London Underground stations capitalised into residential property values, implying households placed substantial economic value on rail accessibility. Ahlfeldt and Feddersen (2018) identified employment and productivity agglomeration effects associated with the Stuttgart high speed rail connection, while Banerjee, Duflo, and Qian (2012) found proximity to transport infrastructure in China to be a significant predictor of long run economic growth. Although the mechanisms differ across contexts, the direction is remarkably consistent: improved connectivity tends to expand economic possibility.
What the Data Shows: An Early Signal
Methodology
So what are we trying to do? Simply put, we want to show that the reopened railway line has led to a meaningful and positive change in the local economy. To measure this, we use the claimant rate (the proportion of the local population claiming unemployment-related benefits) as a proxy for local economic conditions. If economic opportunities genuinely improve following the reopening, we should expect to see the claimant rate fall over time relative to areas that did not receive the rail connection.
To examine whether that effect is visible in the data, this analysis uses a Difference-in-Differences (DiD) design, a standard quasi-experimental method in labour economics. The idea is straightforward: compare how unemployment changed in Levenmouth relative to comparable areas before and after June 2024. Any divergence between the two groups after that date, once common trends are accounted for, could be attributed to the rail link. There is an inherent assumption here: in the absence of the rail link, both groups would have followed parallel trends.
The specification
Yit = αi + γt + δ · Dit + εit
Levenmouth is a relatively small area of Fife, and that creates some data constraints worth being upfront about. First, employment and benefits data published through ONS and NOMIS is only available at ward level, not at the level of individual settlements. This means we cannot observe Methil, Buckhaven, or Leven in isolation; the data aggregates them into two broader wards: Leven, Kennoway and Largo, and Buckhaven, Methil and Wemyss Villages. Second, with only four wards in the analysis (two treatment, two control), statistical power is limited. Standard errors are wide, and cluster-robust inference with four clusters is at best approximate. The −0.28 pp estimate is therefore better treated as a directional signal than a precise causal measurement.
It is also worth being clear about the data window. At the time of writing it is June 2026, meaning the railway has now been open for two years. However, the claimant count data used here only runs to December 2025, giving nineteen months of post-opening observations. Employment data is typically released with a lag of several months, so the most recent published figures do not yet cover the full period of operation. The analysis captures the early trajectory, not the full picture.
The control group consists of Cowdenbeath and Lochgelly, nearby Fife wards with similar deprivation profiles but pre-existing rail access. This makes the comparison conservative: since the control areas already benefit from rail, they are not experiencing the same access deficit as a genuinely unconnected area would. Any effect we detect is therefore likely a lower bound on the true employment impact.
The pre-period runs from January 2022 to May 2024, deliberately chosen to avoid contamination from the Universal Credit rollout (which affected claimant count data from 2017 onwards). The post-period covers June 2024 through December 2025, the nineteen months of post-opening data currently available.
Early findings
The most direct way to see what happened is to look at the raw data. The chart below shows the monthly claimant rate for all four wards from January 2022. The four lines move closely together through 2022 and 2023, tracking the same underlying trend. That parallel movement is what makes the comparison valid: if the wards were already diverging before June 2024, no regression could reliably isolate a rail effect. The fact that they were not is the foundation of the method.
Claimant rate: all four wards, Jan 2022 – Dec 2025
Claimant rate = % of working-age adults (16–64) on unemployment-related benefits. Source: NOMIS / DWP. Treatment wards: solid lines. Control wards: dashed. Vertical line = rail opening, June 2024.
The second chart distils this into the simple before and after comparison that underlies the DiD estimate. Levenmouth's claimant rate fell by 0.67 percentage points on average between the two periods; the control wards fell by 0.39 pp over the same window. Both fell, which reflects a common economic trend affecting all of Fife. But Levenmouth fell further. The net gap, the part of the fall that goes beyond what the common trend would predict, is −0.28 pp.
Before vs after: treatment and control group means
Group means across each period. The DiD estimate is the treatment group's fall (−0.67 pp) minus the control group's fall (−0.39 pp) = −0.28 pp. Stripping out the common downward trend leaves the part attributable to rail.
Taken together, the two charts show what the formal regression quantifies. The Two-Way Fixed Effects estimate for the treatment effect is −0.28 percentage points on the claimant rate: relative to comparable areas, Levenmouth has seen a small reduction in unemployment claims since the reopening.
The estimated p-value using cluster-robust standard errors is 0.441 with four clusters, statistically suggestive but not yet significant at conventional thresholds. This is expected. Nineteen months of data is a short window for structural labour market effects to materialise; residents need to learn routes, build commuting habits, and find employment accessible via the new connection. The signal is in the right direction and consistent with what economic theory would predict. The appropriate response is not to claim proof, but to keep watching.
Revisiting this analysis with full 2026 data, and again with 2027, will be considerably more informative as the adoption curve has more time to develop.
Modelling What Comes Next
Why simulate?
The econometric analysis above tells us what has already happened. Simulation might help us to think about what might happen, and why. Where observational data is limited to a short post-treatment window, an agent-based model (ABM) can project forward under different assumptions and make the underlying mechanisms explicit.
In an ABM, the unit of analysis is the individual rather than the aggregate. Instead of fitting a single equation to population-level data, the model populates a virtual environment with thousands of distinct agents. Each agent has their own characteristics and behaviours with their interactions then producing emergent outcomes. Residents decide whether to search for work, whether to commute by rail, and whether to relocate; businesses respond to local labour supply and customer footfall; the aggregate employment rate is the result of all of these decisions layered together. This bottom-up structure makes it possible to ask questions that regression cannot: what happens if uptake is slower in more deprived zones, or if a new employer opens near the station?
The model used here simulates roughly 3,700 working-age adults and 60 businesses across the five Levenmouth zones. Each zone has its own unemployment rate, SIMD-adjusted deprivation level, and distance to a rail station, which determines how easily residents can adopt rail as part of their commuting behaviour. Businesses respond to local employment levels and rail-driven footfall. Population grows slowly over the five-year simulation window.
The model is calibrated so that the aggregate simulated employment effect at Year 1.5 matches the −0.28 pp DiD estimate from the data. From that point, the simulation projects forward through to Year 5 (June 2029), running matched pairs of "with rail" and "without rail" scenarios across multiple random seeds to smooth out stochastic noise.
What the simulation suggests
The model projects an employment effect that deepens gradually through Years 2 and 3 as rail adoption grows, reaching a peak of around −0.38 pp in Year 3. This peak reflects the initial stock of unemployed residents who adopt rail and find employment, a pattern consistent with Mortensen-Pissarides stock-flow matching dynamics, where an initial burst of employment gains from newly connected workers precedes a slower steady-state equilibrium.
By Years 4 and 5, the effect stabilises at approximately −0.27 to −0.34 pp, smaller than the Year 3 peak but persistent. This long-run figure is not a prediction; it is a modelled plausibility range under current assumptions. The business formation channel shows a smaller, slower signal: rail-accessible zones see incrementally higher business entry and survival rates, but the effect is subtle and takes four to five years to become visible.
Effects vary by zone. Methil and Buckhaven, the most deprived areas with the largest claimant rates, show the strongest simulated impacts. Leven and Kennoway, which are less deprived and have smaller headroom for improvement, show more modest effects. This spatial pattern is economically coherent: rail connectivity matters most where labour market barriers are highest.
Projected employment effect: Jun 2024 – Jun 2029
ABM central projection (median across 15 seeds) with simulation uncertainty band. Solid line: observed data window (Jun 2024 – Dec 2025). Dashed: forward projection to Year 5. Red marker = DiD calibration anchor (−0.28 pp). Values below zero indicate a reduction in the claimant rate relative to control wards.
Explore the simulation yourself
Adjust adoption rates, employment boost, and population growth parameters to see how sensitive the projections are to different assumptions. The dashboard shows the full five-zone breakdown and Year 2–5 outlook cards.
Open the interactive dashboard →What This Means for How We Think About Transport
The Levenmouth case does not prove that rail investment always pays. No single case can. What it illustrates is that the question "does it make money?" is, in my opinion, the wrong starting point for evaluating connectivity infrastructure in communities.
The costs of disconnection (higher unemployment, lower productivity, reduced business formation, constrained educational access) do not appear in the transport account. They appear in the welfare bill, in health outcomes, in the slower growth of regional economies. When a rail line reduces unemployment by even a single percentage point across a population of 37,000, the fiscal and social returns on that investment may substantially exceed what any fare-box calculation would suggest.
The broader implication is methodological. Standard benefit-cost appraisal captures some of what transport investment does. It misses a great deal more. Labour market effects, agglomeration spillovers, business formation, land value uplift, and reduced welfare dependency are all partially or wholly outside the conventional framework. For projects serving high-deprivation areas, this omission is not a minor rounding error; it may be the dominant part of the case.
Fixing this does not require abandoning benefit-cost analysis. It requires extending it: adding, for connectivity projects in high-deprivation areas, an explicit estimate of the fiscal cost of disconnection (the welfare expenditure, reduced tax receipts, and long-run labour market exclusion that accumulate when access is absent). Labour market access should be treated as a direct appraisal outcome, not a secondary benefit. Welfare dependency savings should appear in the appraisal account. These extensions are methodologically feasible; they simply require counting what matters rather than only what is easy to count.
The data from the next three years will be considerably more informative than the first nineteen months. As adoption grows, as businesses respond, as commuting patterns settle, the signal will sharpen. The model suggests it will be worth watching.
The model used here is an early application of ABM methods to transport appraisal; with richer data and longer time horizons, the approach could provide far more detailed projections of connectivity returns than conventional methods allow. I hope the ideas explored here contribute, in some small way, to transport policy decisions that account for the full value of what connectivity does. The same narrowness of thinking that took decades to see the case for Levenmouth is visible in many reactions to major transport investment today. I wrote this article in the shadow of the news that HS2 costs have risen to roughly £102 billion, and the familiar criticism that followed: too expensive, too hard to justify on conventional appraisal grounds.
In my view, this misses the bigger picture entirely. The core case for HS2 rests not on journey time savings along the new route itself, but on what happens to the rest of the network when its most congested trunk lines are freed up. Lines that are currently oversubscribed and running at or near capacity become viable for expanded local and regional services. The connectivity gains that flow through to communities served by those lines depend entirely on whether the wider network has the headroom to accommodate them. Seeing that requires exactly the kind of systems-level thinking that standard appraisal has historically struggled to apply, and that this article has tried, in a small way, to demonstrate.